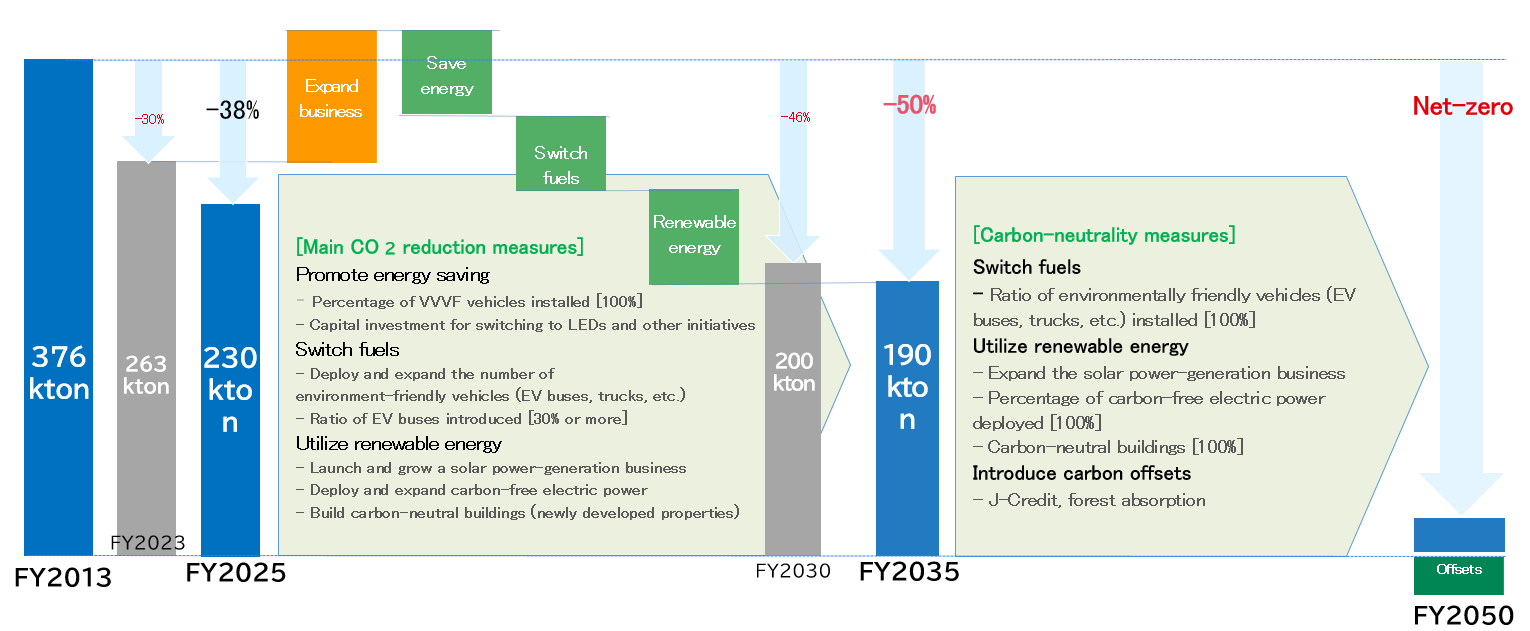
Our group has formulated a long-term vision for which fiscal 2035 is the target year, entitled NNR Group CYD Vision 2035: Grow in harmony with you. Furthermore, we have clearly outlined the roadmap Toward Carbon Neutrality (2050).
Furthermore, we have set reduction targets for the 16th Medium-Term Management Plan (fiscal 2023 to fiscal 2025) in accordance with the roadmap.
CO2 reduction targets:
・Fiscal 2025: 38% reduction from the fiscal 2013 level (16th Medium-Term Management Plan)
・By fiscal 2035, we aim to reduce CO2 emissions by 50% compared to fiscal 2013 (long-term vision). We will achieve the national target of a 46% reduction in CO2 emissions by fiscal 2030 on a fiscal 2013 basis, and strive for carbon neutrality across the entire group by 2050.
The Group's reduction targets for the new national goals outlined in the "GX2040 Vision" will be considered in the next Medium-Term Management Plan.
●CO2 emissions
Our group has formulated a long-term vision for which fiscal 2035 is the target year, entitled NNR Group CYD Vision 2035: Grow in harmony with you. Furthermore, we have clearly outlined the roadmap Toward Carbon Neutrality (2050).
Additionally, the 16th Medium-Term Management Plan (Progress since fiscal 2013)
Our group's energy consumption for fiscal 2024 comprised 44% (1,940 thousand GJ) related to Scope 1 emissions from light oil, city gas, and other fossil fuels, and 56% (2,449 thousand GJ) related to Scope 2 emissions from electricity and heat supply. This represents an increase of 0.8% compared to fiscal 2023.
Energy consumption trends show a reduction across the group as a whole. This reduction stems from business expansions primarily in the hotel and distribution sectors, revised routes and reduced services in the bus business, and the closing, demolition, or selling of buildings in the real estate business. Since fiscal 2020, increased demand for inbound tourism following the recovery from the COVID-19 pandemic has led to higher diesel fuel consumption in the highway bus and sightseeing bus divisions, along with increased electricity usage due to improved hotel room occupancy rates. However, by promoting energy-saving measures such as switching to LED lighting and updating air conditioning equipment, we have maintained a reduction in energy consumption compared to fiscal 2013.
Regarding CO2 emissions reduction, we are working to achieve carbon neutrality by implementing fuel transitions such as switching to electric buses in our bus operations, while also advancing the use of electricity derived from renewable sources like solar power generation. CO2 emissions for fiscal 2024 totaled 236,000 tons, achieving a 37% reduction on a fiscal 2013 basis and a 9% reduction compared to the previous year. Furthermore, the share of renewable energy in total electricity consumption stands at 11% (excluding power company shares).
We will continue to reduce energy consumption by promoting further energy conservation and moving away from fossil fuels, while also striving to reduce CO2 emissions by increasing the proportion of electricity derived from renewable sources.
We have set reduction targets for fiscal 2023 to 2025 in accordance with the roadmap.
CO2 reduction targets:
・Fiscal 2025: 38% reduction from the fiscal 2013 level (16th Medium-Term Management Plan)
・By fiscal 2035, we aim to reduce CO2 emissions by 50% compared to fiscal 2013 (long-term vision). We will achieve the national target of a 46% reduction in CO2 emissions by fiscal 2030 on a fiscal 2013 basis, and strive for carbon neutrality across the entire group by 2050.
The Group's reduction targets for the new national goals outlined in the "GX2040 Vision" will be considered in the next Medium-Term Management Plan.
The Group has established reduction targets for the energy consumption required for business operations, the resulting CO2 emissions, and the usage of copy paper and water. These targets guide us toward more effective initiatives. The results by business category for this fiscal year are as follows: *1
|
Nishitetsu Group |
Transportation |
Real Estate |
Retail |
Logistics |
Leisure and Services |
Other |
|
|
Energy consumption (GJ) *2 |
4,390258 |
2,532,288 |
539,246 |
570,494 |
170,724 |
481,514 |
93,859 |
|
Electricity (thousand kWh) |
279,929 |
105,713 |
56,382 |
63,827 |
5,417 |
41,783 |
6,805 |
|
City Gas (thousand m³) |
2,464 |
58 |
607 |
194 |
0 |
1,603 |
0 |
|
Liquefied Petroleum Gas (thousand m³) |
571 |
475 |
6 |
32 |
19 |
16 |
21 |
|
Autogas (kL) |
1,147 |
1,137 |
9 |
- |
- |
- |
- |
|
Diesel (kL) |
44,918 |
40,915 |
257 |
4 |
3,180 |
44 |
516 |
|
Other fuels (kL) |
1,806 |
346 |
179 |
113 |
57 |
656 |
452 |
|
Heat source (thousand MJ) |
34,298 |
2,930 |
8,071 |
2,930 |
275 |
20,091 |
- |
|
Total CO2 emissions (t-CO2) ※2 |
236,757 |
155,435 |
24,103 |
27,204 |
10,578 |
15,544 |
3,893 |
|
Scope1(t-CO2) ※3 |
130,681 |
111,313 |
2,363 |
848 |
8,485 |
5,227 |
2,445 |
|
Scope2(t-CO2) ※4 ※5 |
106,076 |
44,122 |
21,740 |
26,356 |
2,093 |
10,317 |
1,448 |
|
Water consumption (thousand m³) |
1,381 |
196 |
449 |
167 |
7 |
534 |
25 |
|
Gray Water |
203 |
17 |
161 |
1 |
0 |
22 |
0 |
|
Well Water |
238 |
10 |
81 |
34 |
0 |
111 |
0 |
|
Industrial Water |
57 |
5 |
10 |
0 |
0 |
8 |
33 |
|
Waste Water |
1,717 |
189 |
717 |
123 |
5 |
663 |
18 |
|
Copy paper usage(thousand sheets) *6 |
56,378 |
7,837 |
6,360 |
7,157 |
20,757 |
7,937 |
6,328 |
*1 Scope of coverage: Domestic business sites managed by Nishi-Nippon Railroad and Nishitetsu group companies
*2 Energy consumption and CO2 emissions are calculated in accordance with the Act on the Rational Use of Energy and the Global Warming Countermeasures Act
*3 Scope 1: Direct emissions from fuel use by businesses themselves
*4 Scope 2: Indirect emissions from the use of electricity, heat, and steam supplied by other companies
*5 The CO2 emission conversion factor for heat supply emissions uses Fukuoka Energy Service Co. Inc.'s modified emission factor for the Nishitetsu Fukuoka Station redevelopment area (0.0398 t-CO2/GJ)
*6 Copy paper usage is aggregated based on purchases (without distinction by size
Energy Consumption
| Nishitetsu Group | Unit | FY2022 | FY2023 | FY2024 | ||
| Energy Consumption | Group※1 | GJ | 4,753,228 | 4,352,823 | 4,388,774 | |
| City Gass | Group※1 | m3 | 2,266,095 | 2,360,790 | 2,464,972 | |
| Liquefied Petrol Gas | Group※1 | m3 | 329,677 | 311,751 | 571,898 | |
| Autogas | Group※1 | L | 1,336,963 | 1,230,511 | 1,147,288 | |
| Gasoline | Group※1 | L | 1,125,128 | 1,106,976 | 1,067,525 | |
| Light Oil | Group※1 | L | 45,614,935 | 45,871,811 | 44,918,006 | |
| Heavy Oil | Group※1 | L | 446,185 | 472,129 | 477,144 | |
| Kerosene | Group※1 | L | 244,424 | 214,520 | 261,901 | |
| Heat Source | Group※1 | MJ | 32,482,163 | 34,023,277 | 34,298,446 | |
|
Electricity |
Total | Group※1 | kWh | 275,640,392 | 269,349,835 | 279,929,481 |
| Fossil Fuel | Group※1 | kWh | - | - | 248,532,567 | |
| Fossil Fuel※2 | Group※1 | kWh | - | - | 30,922,761 | |
| Private Power Generation | Group※1 | kWh | - | - | 474,154 | |
*1. Our company, consolidated subsidiaries (domestic), and certain affiliated companies (Kyushu Kyuko Bus Co., Ltd., Dazaifuen amusement park Co., Ltd.)
*2. Non-fossil power includes the amount covered by non-fossil certificates purchased.
CO2 Emmitions
|
CO2 Emmitions |
Nishitetsu Group | Unit | FY2022 | FY2023 | FY2024 | ||||
| Scope1 | Group※1 | tCO2 | 131,565 | 133,707 | 130,681※4 | ||||
| Scope2 | Group※1 | tCO2 | 109,076 | 129,295 | 106,076※4 | ||||
| Scope3※3 |
Single unit※2 |
tCO2 | 1,225,916 | 583,470 | 903,783 | ||||
| Scope3※3 | Category1 Servise | Single unit※2 | tCO2 | 102,192 | 103,377 | 110,951 | |||
| Category2 Capital goods | Single unit※2 | tCO2 | 379,914 | 150,545 | 385,222 | ||||
| Category3 Fuel and Energy-Related Activities | Single unit※2 | tCO2 | 23,570 | 19,594 | 19,754 | ||||
| Category4 Transportation, Delivery | Single unit※2 | tCO2 | 689,393 | 285,093 | 360,977 | ||||
| Category6 Bussiness Trip | Single unit※2 | tCO2 | 23,570 | 19,594 | 19,754 | ||||
| Category7 Commute | Single unit※2 | tCO2 | 1,093 | 794 | 956 | ||||
| Category11 Use of sold product | Single unit※2 | tCO2 | 2,542 | 1,088 | 1,107 | ||||
| Category13 Leased assets (downstream) | Single unit※2 | tCO2 | 26,642 | 20,659 | 21,318 | ||||
*1. Our company, consolidated subsidiaries (domestic), and certain affiliated companies (Kyushu Kyuko Bus Co., Ltd., Dazaifuen amusement park Co., Ltd.)
*2. Our company only
*3. Categories 5, 8, 9, 10, 12, 14, and 15 are excluded based on importance assessment.
*4. Starting in fiscal 2024, we have utilized a third party to verify our performance.
Water Consumption
| Nishitetsu Group | Unit | FY2022 | FY2023 | FY2024 | ||
| Water Consumption※1 |
Group※2 |
m3 | 1,912,754 | 1,976,200 | - | |
| Water Withdrawal | Group | m3 |
- |
- |
1,381,007 | |
|
Gray Water |
Group | m3 | - | - | 203,652 | |
| Well Water | Group | m3 | - | - | 238,067 | |
| Industrial Water | Group | m3 | - | - | 57,237 | |
| Waste Water | Group | m3 | - | - | 1,717,427 | |
*1. Total water usage for fiscal 2022 and 2023 was calculated as the sum of the maximum water usage amounts at each location.
*2. Our company, consolidated subsidiaries (domestic), and certain affiliated companies (Kyushu Kyuko Bus Co., Ltd., Dazaifuen amusement park Co., Ltd.)
Copy paper
Copy Paper
| Nishitetsu Group | Unit | FY2022 | FY2023 | FY2024 | |
| Copy Paper | Group※1 | sheets | 59,648,797 | 57,876,693 | 56,378,505 |
*1. Our company, consolidated subsidiaries (domestic), and certain affiliated companies (Kyushu Kyuko Bus Co., Ltd., Dazaifuen amusement park Co., Ltd.)
In the 16th Medium-Term Management Plan, which sets fiscal 2025 as the target year, the Nishitetsu Group has formulated and is implementing an environmental impact reduction plan that includes specific targets for each division and company based on priority items for the Group.
At the ESG Promotion Committee, progress on the evaluation of targets and the implementation status of specific measures is reviewed every six months.
〇Initiatives to achieve a decarbonized society 〇Initiatives to achieve a recycling-oriented society
- Compliance with the revised Act on the Rational Use of Energy - Proper disposal of waste
- Reduction of CO2 emissions (absolute volume, individual intensity) - Reduction of copy paper and water consumption
Numerical target setting
Set based on the overall goals.
〇Initiatives by Divisions and Companies initiatives 〇Environmental risk management
1) CO2 emissions(absolute volume, individual intensity) 1) Environmental Training Sessions
*Individual intensity: CO2 emissions divided by Numerical target setting Annual training is conducted for
a value closely related to the emissions Support environmental managers to address
2) Workplace Visits
2) copy paper Formulation of specific measures Visits are made to confirm the status of
3) water consumption, numerical environmental impact reduction activities
and compliance with relevant regulations.
○Improving information disclosure
The Group actively communicates updates on the progress of our environmental impact reduction plans through our website, securities
reports, and the CDP.
※Environmental management framework (sustainable management)
The Group has established the ESG Promotion Committee to discuss, deliberate, and monitor key issues related to environmental management across the entire organization under sustainable management. The committee reviews the progress of the environmental impact reduction plans every six months, evaluating performance against set targets and monitoring the implementation of specific measures
|
Target item |
Targets for the final year of the Medium-term Management Plan (end of FY2025) |
Actual results for FY2024 |
Results |
|
Reduction of CO2 emissions (absolute volume) *1 *2 |
25% decrease from FY2013 |
▲26.3% |
◎ |
|
Reduction of copy paper usage *3 |
25% decrease from FY2014 |
▲30.4% |
◎ |
|
Reduction of water consumption |
15% decrease from FY2014 |
▲10.2% |
〇 |
*1 For calculating CO2 emissions from electricity, the emission factor [0.37 kg-CO2/kWh] published by the Federation of Electric Power Companies of Japan and others in July 2015 in the “Low-Carbon Society Action Plan in the Electricity Industry” was used as a control value
*2 For calculating CO2 emissions from energy sources other than electricity, the Ministry of the Environment's Greenhouse Gas Emissions Calculation and Reporting Manual (FY2013) was referenced
*3 Copy paper usage is aggregated based on purchases (without distinction by size)
The Environmental Impact Reduction Plan uses the above indicators for target management
Our group has established target values for each department. We are disclosing the 2024 performance results for CO2 emissions (absolute volume, individual intensity), copy paper usage, and water consumption against these targets.
|
Department |
Targets by FY2024 (Compared tp FY2013) |
Results(Unit:t-CO2) |
Compared to FY2013 |
Results |
Reason for achievement/non-achievement |
||
|
FY2013 |
FY2024 |
||||||
|
Nishi-Nippon Railroad |
Buses |
▲29.0% |
93,187 |
66,159 |
▲ 29.0% |
◎ |
・Introduction of and replacement with environmentally friendly vehicles ・Digital tachograph evaluation criteria update (fuel efficiency improvement) ・Continuing the implementation of the idle stop system ・Implementation of exhaust gas removal measures and periodic maintenance of fuel injection systems (continuous implementation plan every three months) |
|
Railway |
▲14.0% |
39,713 |
34,902 |
▲ 12.1% |
〇 |
・Introduction of VVVF-controlled vehicles ・Upgrading to energy-efficient equipment ・Continuing energy-saving activities at stations and offices |
|
|
Housing |
▲51.0% |
144 |
53 |
▲ 62.8% |
◎ |
・Increased awareness of energy conservation ・Work-style reforms (reduction of overtime work) ・Mid-year gallery closure |
|
|
Urban development (commercial facilities |
▲28.2% |
12,440 |
8,331 |
▲ 33.0% |
◎ |
・Improved energy efficiency through equipment upgrades (replacement of air conditioning systems) |
|
|
Urban development (buildings) |
▲30.3% |
9,376 |
4,950 |
▲ 47.2% |
◎ |
・Replacement of air conditioning systems ・LED conversion ・Installation of solar power generation |
|
|
Global Logistics |
▲13.0% |
1,770 |
1,336 |
▲ 25.0% |
◎ |
・Increased emissions due to higher operational volume resulting from the establishment of a new base and increased cargo volume ・Reducing emissions through solar power generation and renewable energy utilization |
|
|
Headquarters Division |
▲9.0% |
255 |
231 |
▲ 9.1% |
◎ |
・Strengthened air conditioning management in shared areas |
|
|
Nishitetsu Group |
Nishitetsu Bus Kitakyushu Co., Ltd. |
▲26.3% |
23,474 |
17,209 |
▲ 26.6% |
◎ |
・Implementation of route restructuring ・Vehicle introduction |
|
Chikuho Electric Railroad Co., Ltd. |
▲28.0% |
1,438 |
1,018 |
▲29.2% |
◎ |
・Turn off lights when away ・Turn off your computer screen when away from your desk |
|
|
Hakata Bus Terminal Co., Ltd. |
▲25.0% |
3,630 |
2,692 |
▲ 25.8% |
◎ |
・Conversion of backyard lighting to LEDs and installation of motion sensor lighting controls |
|
|
Nishitetsu-unyu Co., Ltd. |
0 |
6,552 |
7,611 |
0 |
◎ |
・Expanding in-house transportation capacity |
|
|
Uminonakamichi Marine Ecology Science Museum Co., Ltd. |
▲32.1% |
3,639 |
2,580 |
▲ 29.1% |
〇 |
・Increased operation of heating equipment due to extreme heat and severe cold |
|
|
Nishitetsu Store Inc. |
▲25.0% |
30,927 |
23,284 |
▲ 25.0% |
◎ |
・New store openings and closures ・Extended or shortened business hours |
|
|
Nishitetsu Hotels Co., Ltd. |
▲42.8% |
16,078 |
9,620 |
▲ 40.1% |
〇 |
・ Introduction of carbon-free electricity |
|
|
Department |
Targets by FY2024 (Compared tp FY2013) |
Results(Unit:t-CO2) |
Compared to FY2013 |
Results |
Reason for achievement/non-achievement |
||
|
FY2013 |
FY2024 |
||||||
|
Nishi-Nippon Railroad |
Buses |
7.00% |
0.83 |
0.9 |
9.00% |
△ |
・Reduced mileage due to decreased usage |
|
CO2 emissions per kilometer (thousand km) traveled |
|||||||
|
Railway |
▲9.0% |
0.98 |
0.9 |
▲ 8.3% |
〇 |
・Increase in energy-efficient vehicles (VVVF trains) ・Reduction in vehicle mileage due to timetable revisions and natural disasters |
|
|
CO2 emissions per kilometer (thousand km) traveled |
|||||||
|
Housing |
▲29.0% |
2.45 |
1.34 |
▲ 45.0% |
◎ |
・Improvement in unit costs due to increased employee numbers |
|
|
CO2 emissions per employee |
|||||||
|
Urban development (commercial facilities) |
▲27.5% |
51.83 |
35.06 |
▲ 32.4% |
◎ |
・Improved energy efficiency through equipment upgrades (replacement of air conditioning systems) |
|
|
CO2 emissions per thousand square meters of total floor area |
|||||||
|
Urban development (buildings) |
▲23.8% |
0.1 |
0.06 |
▲ 38.9% |
◎ |
・Reduction in leasable area due to securitization of properties ・Switch to a 100% renewable electricity contract |
|
|
CO2 emissions per rentable area multiplied by occupancy rate (m²) |
|||||||
|
Global Logistics |
▲31.0% |
16.55 |
10.32 |
▲ 38.0% |
◎ |
・Increase in import and export cargo weight ・Increase in the use of renewable energy (electricity) |
|
|
CO2 emissions per average percentage change in import/export cargo weight |
|||||||
|
Headquarters Division |
▲9.0% |
33.5 |
32.2 |
▲ 4.0% |
◎ |
・Increased electricity consumption due to heating and cooling usage |
|
|
CO2 emissions per thousand square meters of total floor area |
|||||||
|
Nishitetsu Group |
Chikuho Electric Railroad Co., Ltd. |
▲14.0% |
1.51 |
1.27 |
▲ 15.6% |
◎ |
・Decrease in train operating kilometers |
|
CO2 emissions per kilometer (thousand km) traveled |
|||||||
|
Hakata Bus Terminal Co., Ltd. |
▲25.0% |
79.56 |
0.59 |
▲ 99.2% |
◎ |
・Conversion of backyard lighting to LEDs and installation of motion sensor lighting controls |
|
|
CO2 emissions per thousand square meters of total floor area |
|||||||
|
Nishitetsu-unyu Co., Ltd. |
▲6.0% |
0.52 |
0.5 |
▲ 5.0% |
〇 |
・Promoting transportation efficiency |
|
|
CO2 emissions per kilometer (thousand km) traveled |
|||||||
|
Uminonakamichi Marine Ecology Science Museum Co., Ltd. |
▲32.1% |
252.72 |
179.18 |
▲ 29.0% |
〇 |
・Increased operation of heating equipment due to extreme heat and severe cold |
|
|
CO2 emissions per thousand square meters of total floor area |
|||||||
|
Nishitetsu Store Inc. |
▲18.0% |
64.03 |
54.15 |
▲ 15.0% |
〇 |
・New store openings and closures ・Extended or shortened business hours |
|
|
CO2 emissions per sales floor space x operating hours (thousand m2/h) |
|||||||
|
Nishitetsu Hotels Co., Ltd. |
▲46.9% |
12.15 |
6.81 |
▲ 43.9% |
〇 |
・Opening of one store (Gion) ・Increase in the number of operational rooms |
|
|
CO2 emissions per thousand rooms in operation per year |
|||||||
|
Department |
Targets by FY2024 (Compared tp FY2014) |
Results(Unit:Thousand sheets) |
Compared to FY2014 |
Results |
Reason for achievement/non-achievement |
||
|
FY2014 |
FY2024 |
||||||
|
Nishi-Nippon Railroad |
Global Logistics |
▲7.0% |
25752 |
18577 |
▲ 27.8% |
◎ |
・Continued use of DocuWorks ・Electronic invoicing ・Effective use of copy paper |
|
Headquarters Division |
▲59.0% |
5179 |
18577 |
▲ 59.0% |
◎ |
・Raising awareness about reducing paper usage in preparation for the relocation of the head office ・Recommendation for electronic data storage in anticipation of headquarters relocation |
|
|
Nishitetsu Group |
Nishitetsu Travel Co., Ltd. |
▲48.0% |
5542 |
2434 |
▲ 56.0% |
◎ |
・Recommended use of web conferencing ・Promoting the shift of forms and documents to web-based formats |
|
Nishitetsu Store Inc. |
▲20.0% |
7576 |
6824 |
▲ 10.0% |
〇 |
・Promotion of double-sided printing ・Reduction of printing presses |
|
|
Nishitetsu Hotels Co., Ltd. |
▲32.9% |
4438 |
2722 |
▲ 38.7% |
◎ |
・Use of the back side of cleaning instruction reports ・Reduction in the number of printed copies for daily sales reports, etc. |
|
|
Department |
Targets by FY2024 (Compared tp FY2014) |
Results(Unit:Thousand m3) |
Compared to FY2014 |
Results |
Reason for achievement/non-achievement |
||
|
FY2014 |
FY2024 |
||||||
|
Nishi-Nippon Railroad |
Buses |
▲37.0% |
124 |
74 |
▲ 39.7% |
◎ |
・Expanding the introduction of water-saving car wash machines ・Continued reduction in car wash machine usage frequency |
|
Urban development (commercial facilities |
▲19.6% |
533 |
442 |
▲ 17.0% |
〇 |
・Encouraging tenants to save water ・Rental of water-saving automatic devices |
|
|
Nishitetsu Group |
Nishitetsu Bus Kitakyushu Co., Ltd. |
▲36.0% |
45 |
31 |
▲ 31.9% |
〇 |
・Use of water-saving devices (e.g., water-saving taps) ・Efficient use of car washing machines |
|
Nishitetsu Store Inc. |
▲9.2% |
221 |
201 |
▲ 8.7% |
〇 |
・Strict water conservation using water control devices |
|
|
Nishitetsu Hotels Co., Ltd. |
0.069 |
614 |
732 |
0.192 |
△ |
・Impact of increased water usage due to new business openings ・Installation of water-saving devices at new hotels |
|